Frugal’s notes: This post was originally posted on March 26th at BuyTheBottom.com before some market setbacks.
Volatility Index
VIX [ http://www.buythebottom.com/vix.html ]
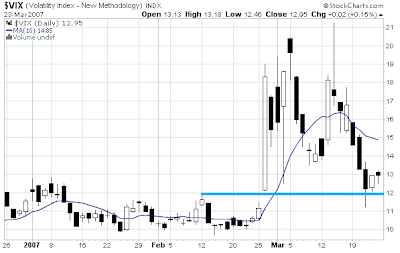
Commercials were sellers of the VIX index when it broke out, since, then the VIX has declined to retest old-resistance, which is now support at around 12 dollars. In the short-term, it looks like the VIX is overextended to the downside, so we will probably see a re-test of the 10-day moving average. From a longer-term perspective and the commercial setup, it looks like we are going to break below 12 and return to a period of low volatility.
Broad Markets
Russell 2000 [ http://www.buythebottom.com/rut.html ]
Commercials were big buyers last week of this index, as well as all the other indexes. Not too long ago, commercials were sellers at these price levels, and now they have turned around 180 degrees and are buying at these levels. I was anticipating the market to decline further before commercials would get interested in the stock market, but they proved me wrong. It looks like the double bottom at 760 is for real, and that we are headed towards higher prices in the intermediate-future.
S&P 500 [ http://www.buythebottom.com/spx.html ]
Total net-commercial position currently stands at -4,783. The last time net-commercial position was this high was back in late-2005. This is very bullish as far as COT setups are concerned. The double bottom near 1378 should hold, as this setup is forecasting higher prices in the intermediate-term.
NASDAQ 100 [ http://www.buythebottom.com/ndx.html ]
Net-commercial position increased by roughly 20,000 contracts, confirming the other bullish COT setups on the rest of the indexes. Once again, the double bottom at 1,720 should hold, and higher prices are the forecast for the intermediate-term.
Dow Jones [ http://www.buythebottom.com/indu.html ]
Net-commercial position increased by over 25,000 contracts. This probably means that the double bottom at 12,050 should hold, as this COT setup forecasts higher prices in the intermediate-term.
After just one week, most of the index COT charts transformed from bearish setups to bullish setups. This just goes to show how dramatically the markets can change, and also that we – as investors – must be able to ADAPT to these sorts of changes. The key here is to stay open minded. A week ago the melt-down that started in late February looked like the beginning of something big; instead, it now looks like a critical bottom has been put in place. Also, notice the RUT broke right back above 800.
Commodities
Crude Oil [ http://www.buythebottom.com/wtic.html ]
Oil broke below $60, but found support near $57 and then rallied back above $60. Commercials continue to sell this market, so it looks like a bearish setup is in the works. There is very significant resistance above $64 for crude. For now, oil remains in a trading range (57 – 64); and even though commercials are sellers over the last little while, it is important to follow the trend which continues to point up…as long as oil remains above $60.
Gold [ http://www.buythebottom.com/gold.html ]
The picture with gold is not entirely clear. While commercials were buyers over the last little while, is this enough fuel for gold to go up and challenge its 2006-high near 730? This COT setup would have been much more bullish if net-commercial position moved to new highs on the 1-year-COT-chart, to roughly -75,000. For now, it looks like this market is poised to challenge its resistance at 690. Other than that, bullion continues to stay range-bound from a big-picture perspective, in between roughly 550 and 730.
Currencies
US Dollar [ http://www.buythebottom.com/usd.html ]
The US dollars is setup for a rally, and is literally touching strong support at $82.5. If the USD holds above $82.5, then it looks like we will see a leg-up develop from these levels to perhaps challenge resistance at $85.5 – 87.5.

